The following project was for my client – Canada’s largest restaurant chain. The purpose of the project was to analyze former employee reviews as well as the survey responses that former employee submitted after they left the company.
DATA DESCRIPTION:
Most of our data consists of positive reviews and is highly imbalanced towards the positive side. This is something we will need to address when building classification models.
The most important column names for our analysis:
- Rating – rank that former employees assigned to a category which ranges from 0 to 5.
- Category – work conditions that former employees evaluated (i.e Salary, Management, Culture, Advancement, Work-Life Balance)
- Comment – review left by former employees
- Date – date of the review (2012 – 2019)
SENTIMENT ANALYSIS:
Sentiment analysis is used to identifies and extract opinions within a text and attributes of the expression. It can help us understand whether the review is positive or negative, identify the main subject of the review, and identify emotions that employees are expressing.
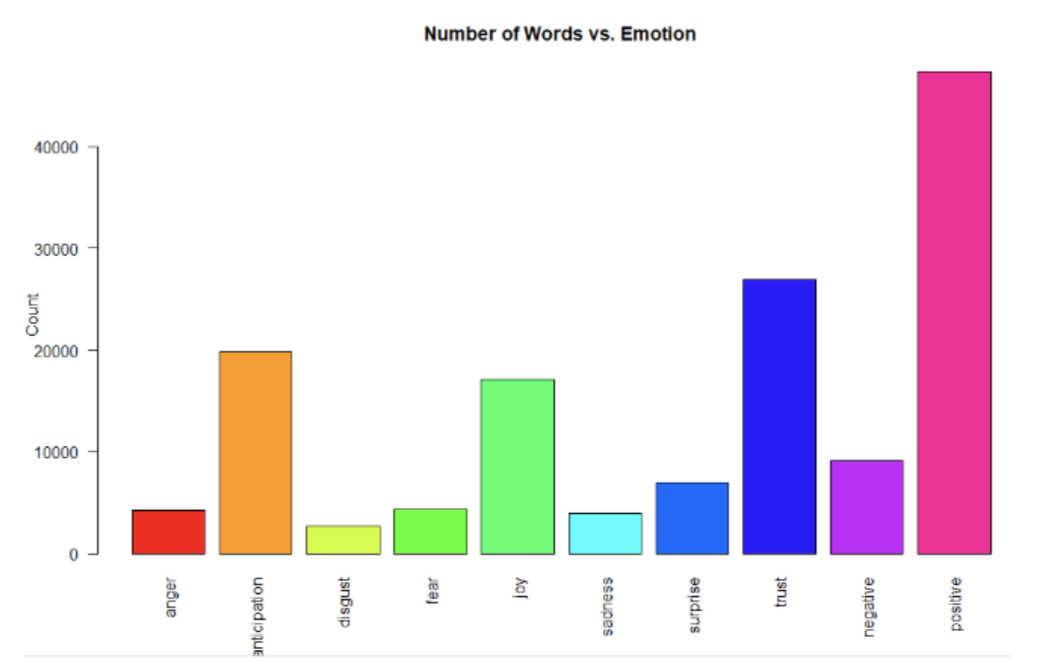
When looking at the words used in the review, note, that most of them are positive and express trust, joy and anticipation.
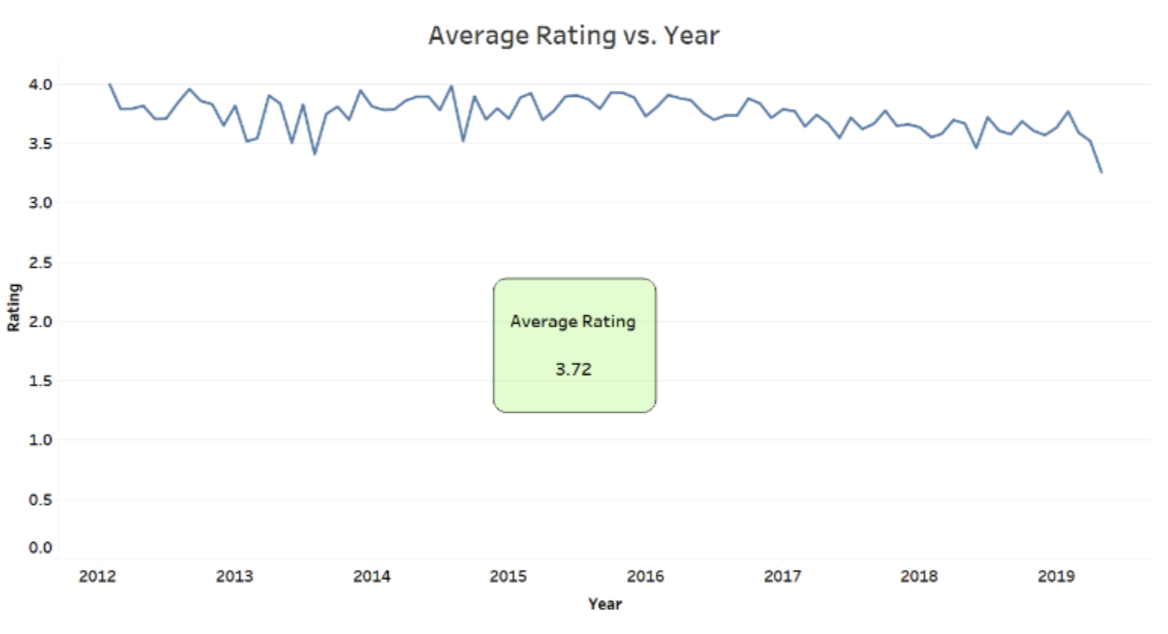
Note, that the average rating ~3.7 out of 5 is stable over the years across categories, showing us that most former employees were happy to work at the company.
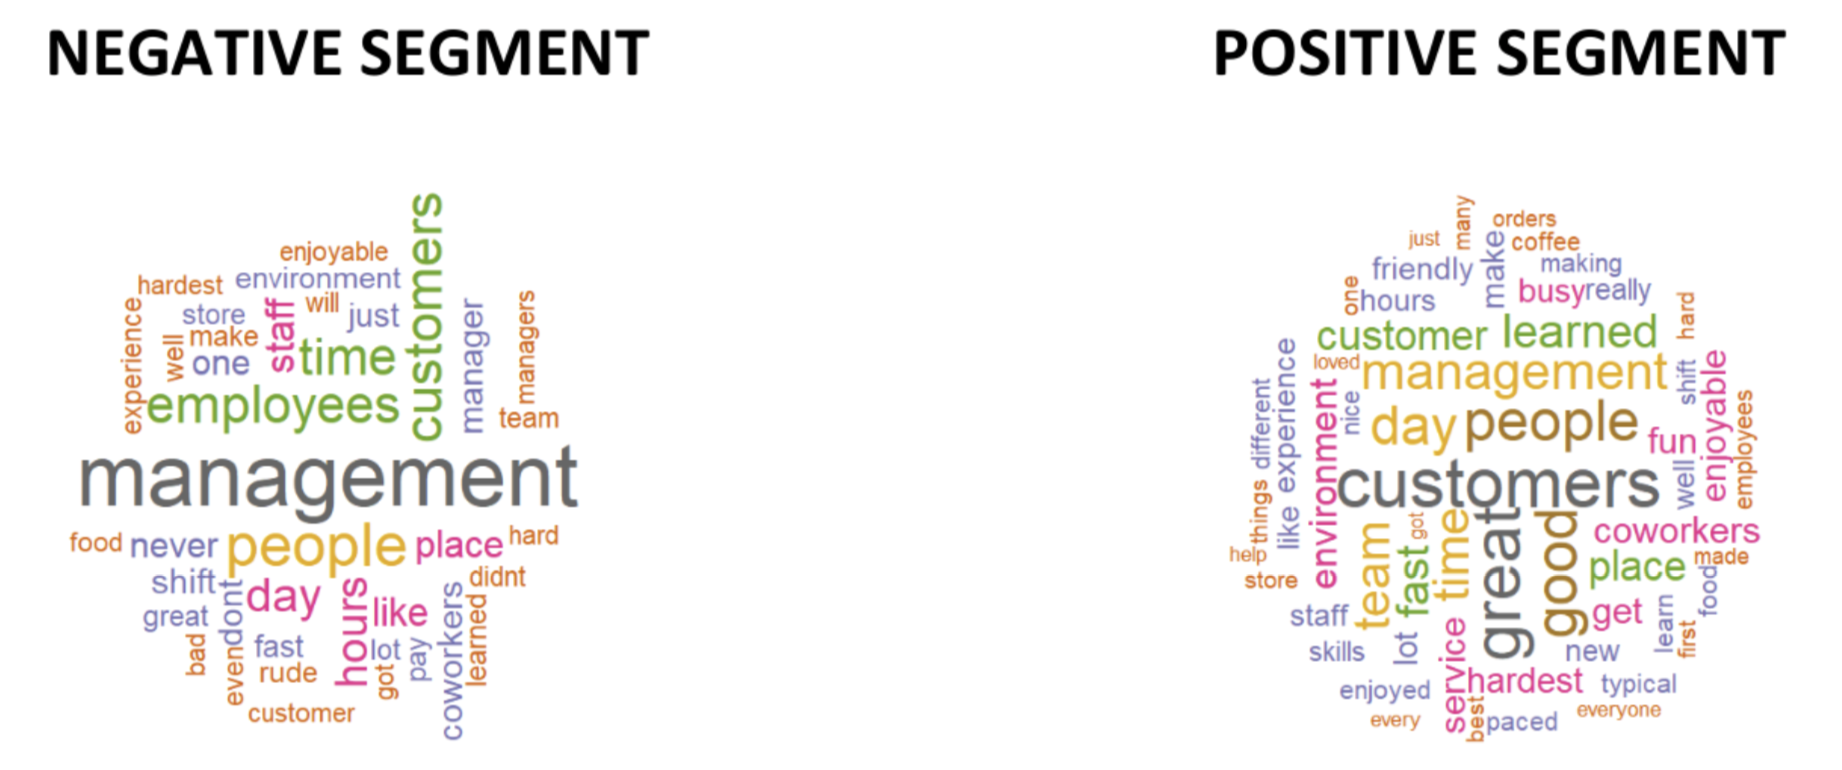
We can break down the reviews further into negative and positive segments and see what words are used to express the emotions. Note, that most negative reviews mention management, employees, people and customers, while others mention pay and working hours.
Positive reviews, on the other hand, show that most employees are happy to work with customers and enjoy the environment.
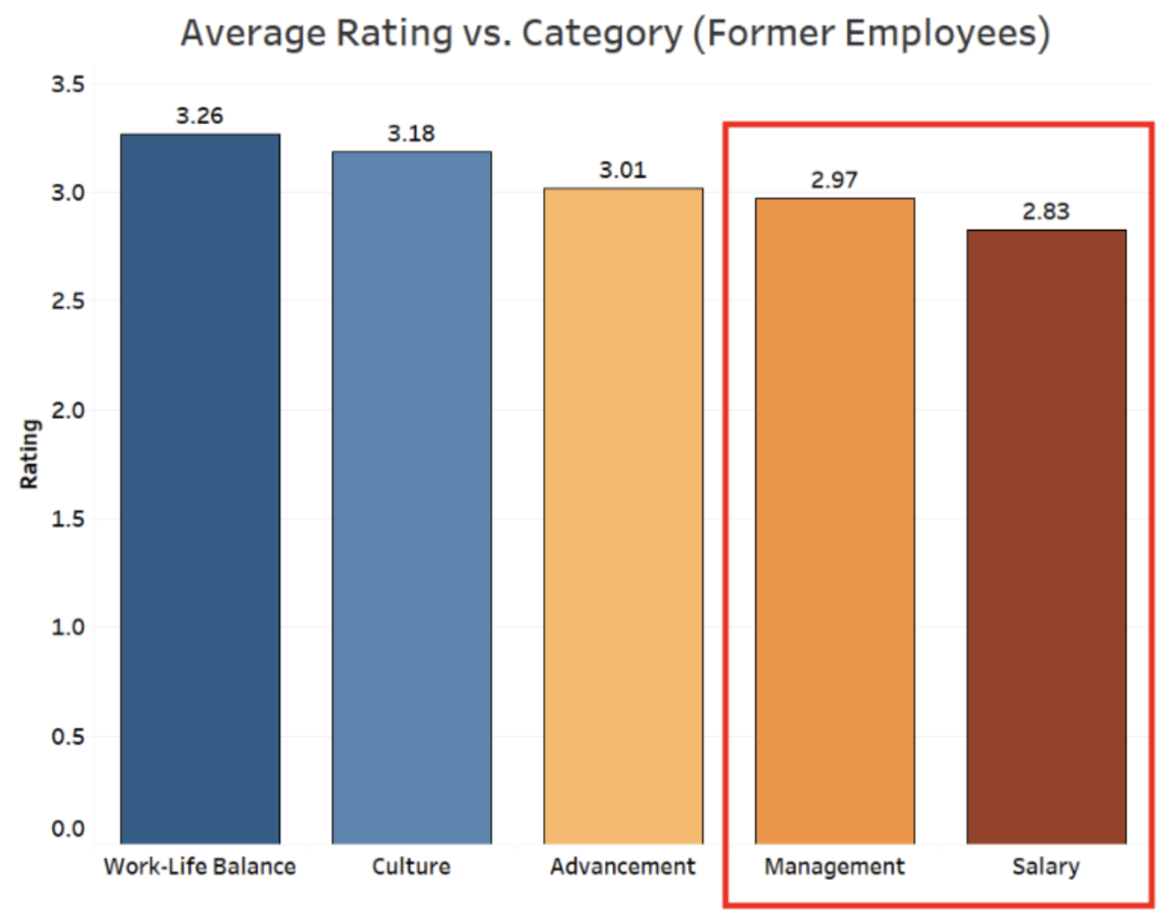
When looking at the average rating by category, we notice that management and salary have the lowest average score over the years. This is something the company should focus on to keep the employees happy and work for the company longer.
DATA PRE-PROCESSING:
Because the data is made up of text reviews, there are things we need to fix to build our model and make sentiment predictions more accurate.
- Punctuation – remove all punctuation such as commas, full stops, semi-colons, dashes and other symbols
- Convert all data to lowercase to avoid confusion
- Extract roots from words that can have multiple forms and have the same meaning (i.e management vs manager vs managing) and use them for our model
Since our data is highly imbalanced towards the positive reviews, we will need to use an oversampling technique, which would create artificial negative reviews to make the data balanced.
Then, we will build 3 classification models that will classify the reviews into negative and positive segments. We are using our pre-processed data as input for the models and a decision variable whether the review is positive or negative as the output variable.
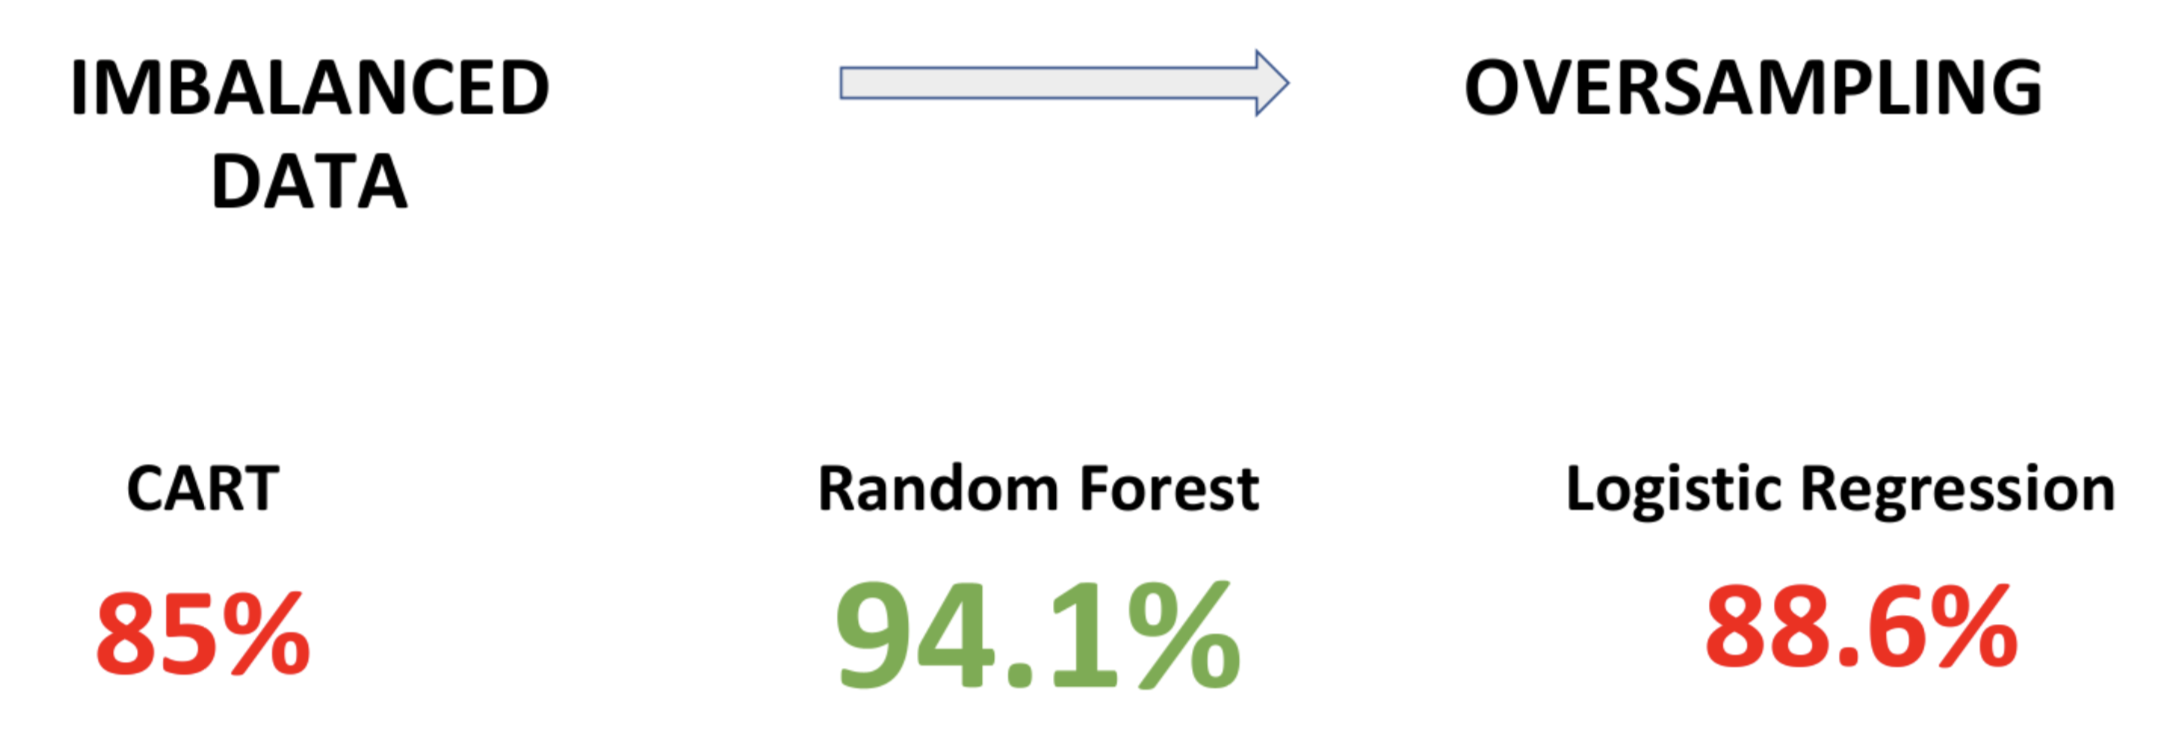
Classification and Regression Tree (CART) and Logistic Regression models are fairly simple to build and do not require too much time and computational resources. As we observe, they both provide us with a mid-high 80% of accuracy in classifying the reviews.
Random Forest algorithm, on the other hand, gives us a much higher accuracy of 94%. However, it requires more time and resources it takes to build and run.
RECOMMENDATIONS & FURTHER ANALYSIS:
- Review compensation
- Consider management training
- Utilize machine learning models for reviews classification
- Consider other models accounting for computational resources and time
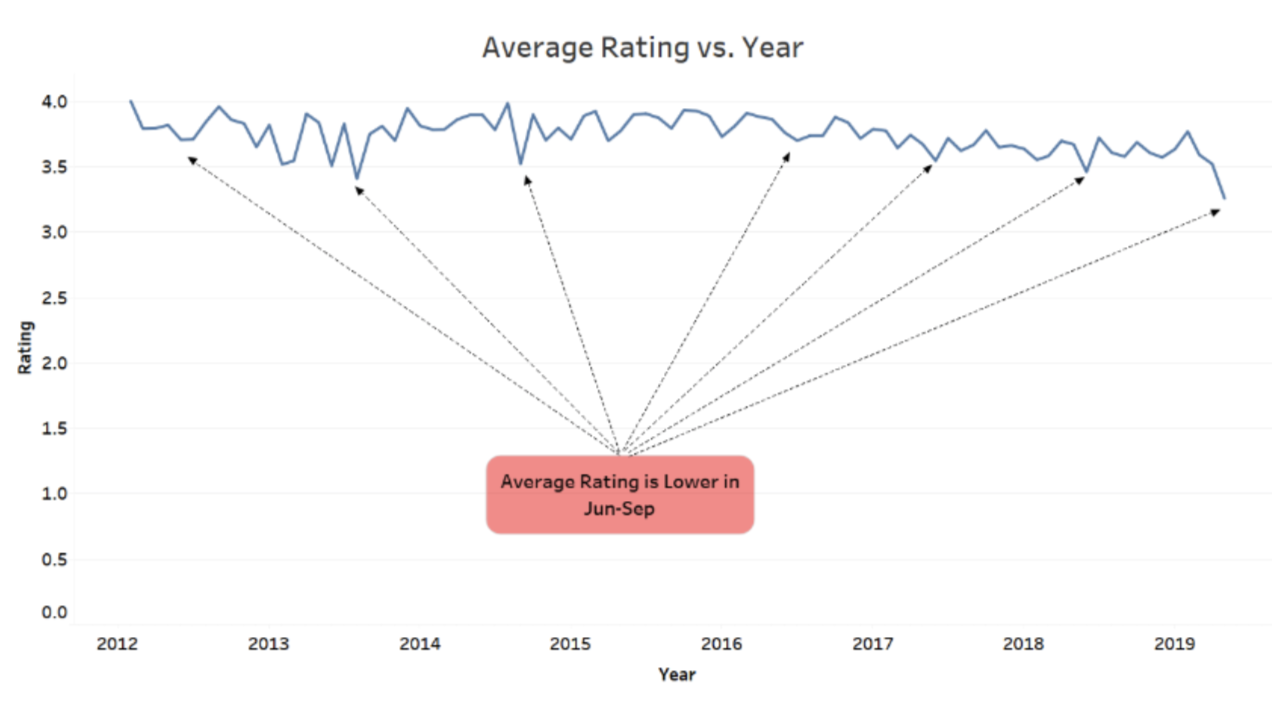
- Identify why average rating is lower during the summer (Jun-Sep) as per image below