PROJECT OVERVIEW:
Tailored Brands is a known US men’s apparel retail store. The purpose of this project is to analyze their 2020-2021 transactions, assess overall sales performance and answer the following questions:
- Measure core KPIs for 2021
- Assess the overall YoY sales performance
- Identify the best performing stores
- Analyze customer profiles
DATA PRE-PROCESSING:
Before I started exploratory analysis, I pre-processed the data by solving hygiene issues: removed transactions with 0 and negative quantity (~3% of all data), imputed missing COGS values, and removed duplicates.
EXPLORATORY ANALYSIS:
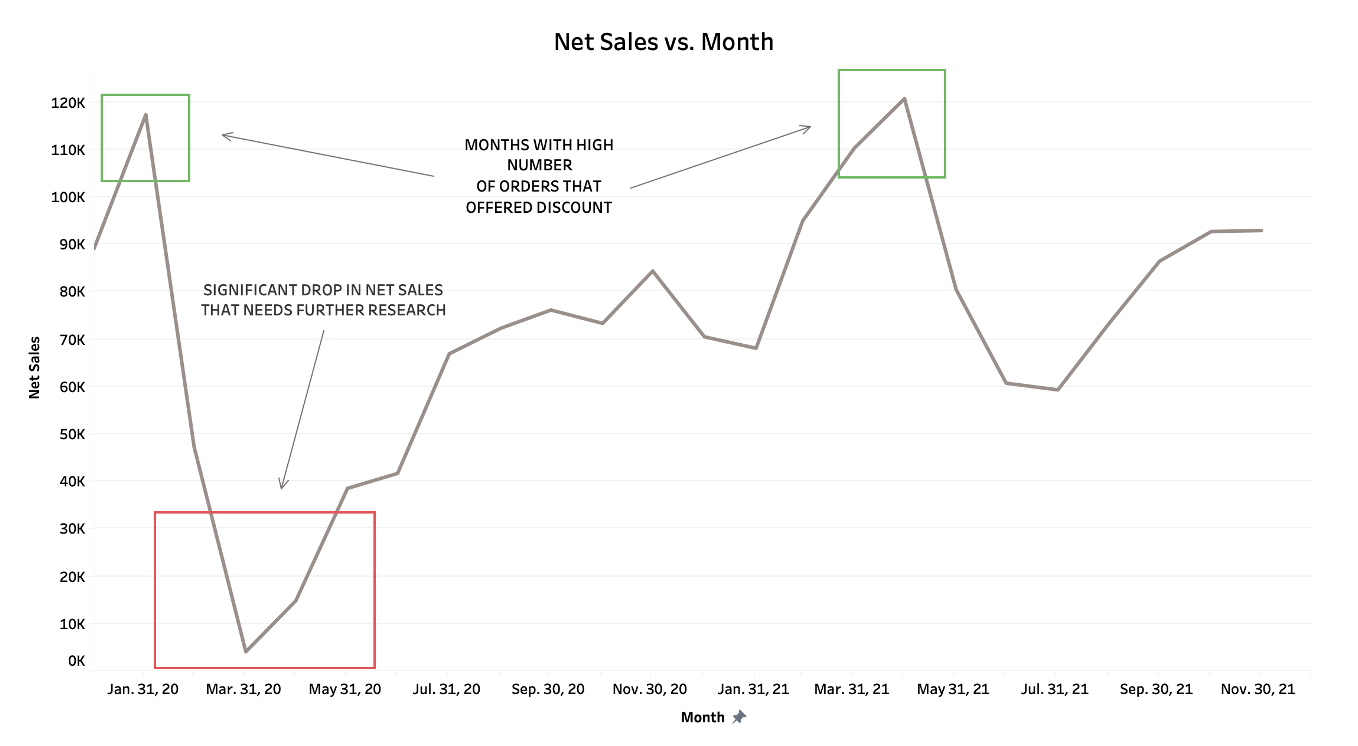
Net Sales:
First, we want to understand the overall health of the business by plotting a monthly net sales chart. As we see, there is a positive trend that started after a significant drop in March, 2020. We can also observe two major spikes that happened in Jan, 2020 and May, 2021 due to a large number of discounts that company offered, which led to a massive increase in the number of transactions and overall net sales.
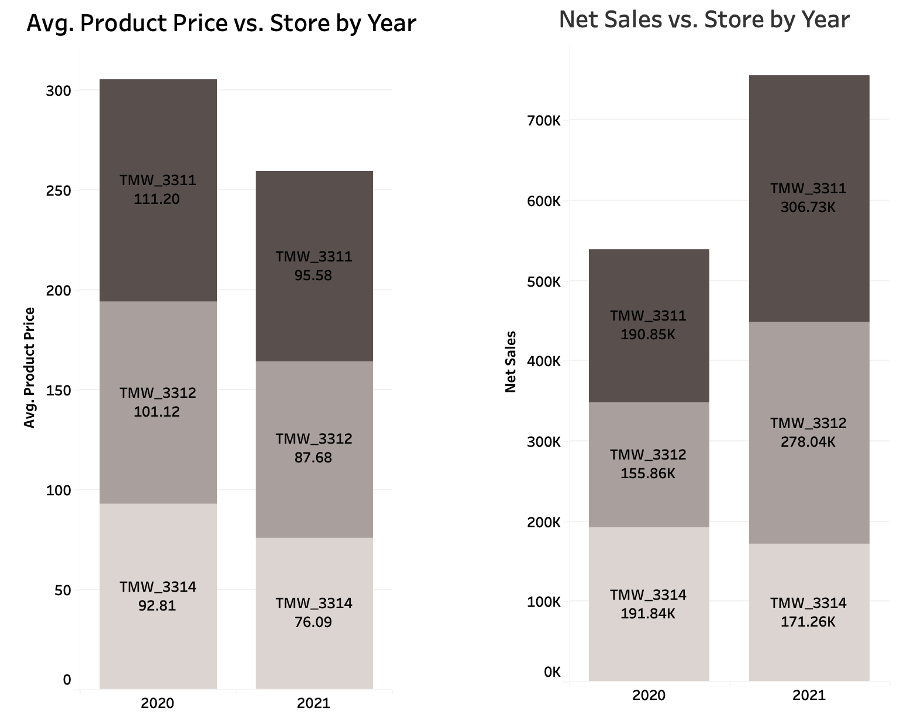
When looking at the total net sales YoY, there’s a 40% increase, explained by the growth in customer base and the number of transactions, which both increased by roughly 50%.
Sales margin, on the other hand, remained consistent YoY, despite the fact that average price of sold items was 18% higher in 2020, partially offset by higher discounts in 2020 (13% higher).
Average order size has decreased compared to 2020.
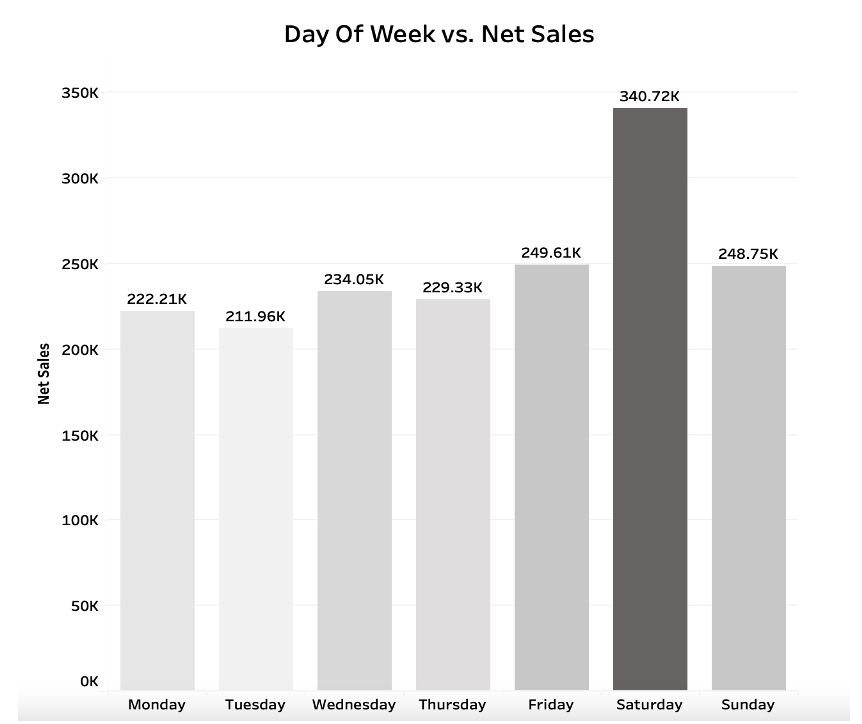
Stores’ Analytics:
According to the chart below, Friday – Sunday exhibit the highest net sales combined for both online and offline channels, Saturday being the best performer.
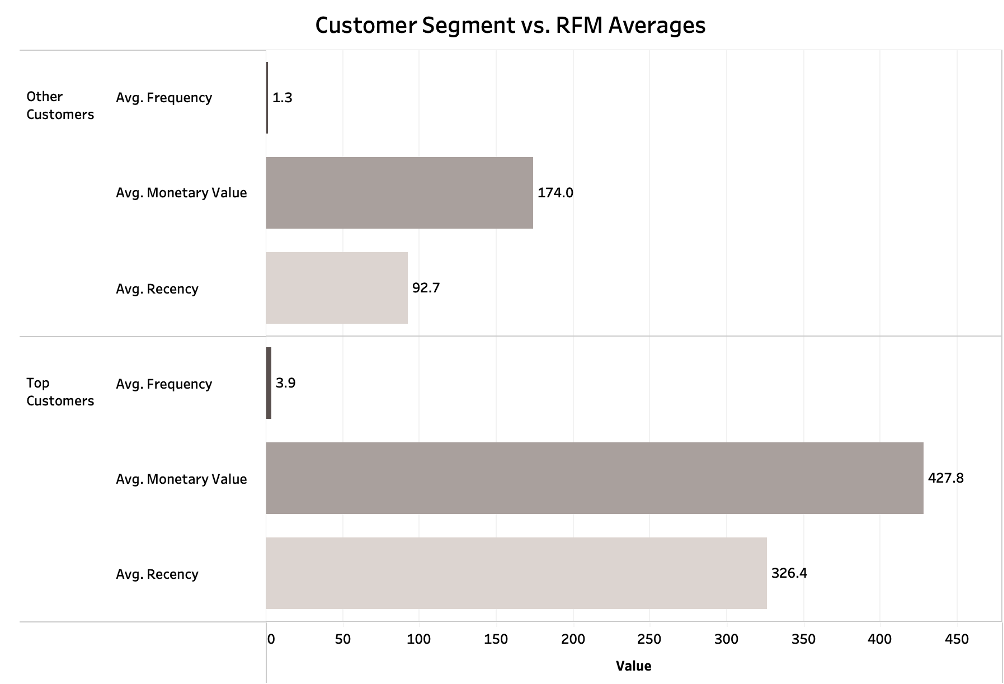
CUSTOMER ANALYSIS (RFM MODEL):
To analyze customer behaviour and identify top customers, we are segmenting our user base by using an RFM model by following the next steps:
- Rank customers in each of the following categories: recency, frequency, and monetary value
- Normalize the above ranks to bring the data to the same scale
- Compute the RFM score for each customer
- Segment customers into “top customers” and ”other customers”
FINAL RECOMMENDATIONS:
To analyze customer behaviour and identify top customers, we are segmenting our user base by using an RFM model by following the next steps:
- Monitor important KPIs
- Increase average order value by up-selling & cross-selling
- Identify the reasons of TMW-3314 store poor performance and take actions based on that
- Segment customers into more groups and analyze their purchasing patterns
- Attract more “top” customers through marketing campaigns